I started the week off on Sunday the 20th, reviewing my past trades, charts, and a couple of study materials to prepare for the coming week.
While reviewing my trades, I realized that I reduced my avg % loss by a couple of percentage points. So it’s great to see that I’m off to a great start sticking to my trading plans.
In addition to reviewing my trades, I also created my first independent watchlist for Monday morning and the early afternoon.
What was awesome it that my watchlist ended up containing many of the same tickers Bohen, Sykes, and Kellog had.
Before I called it a night that Sunday, I watched the latest STT video on youtube with Tim Grittani, going over his 2 favorite custom screeners.
It never hurts to have several scanners and screeners to help you become a better trader. If a ticker keeps showing up, It may be more of an indication of a good trade with several entry options.
On Monday morning, several of the tickers on my watchlist were also on Oracle’s list. $TRCH $AEI $ALF $LKCO $GERN $PSWW
Unfortunately, $GERN ended up failing right out the gate, and I felt like there were better options out there to try and catch a bounce.
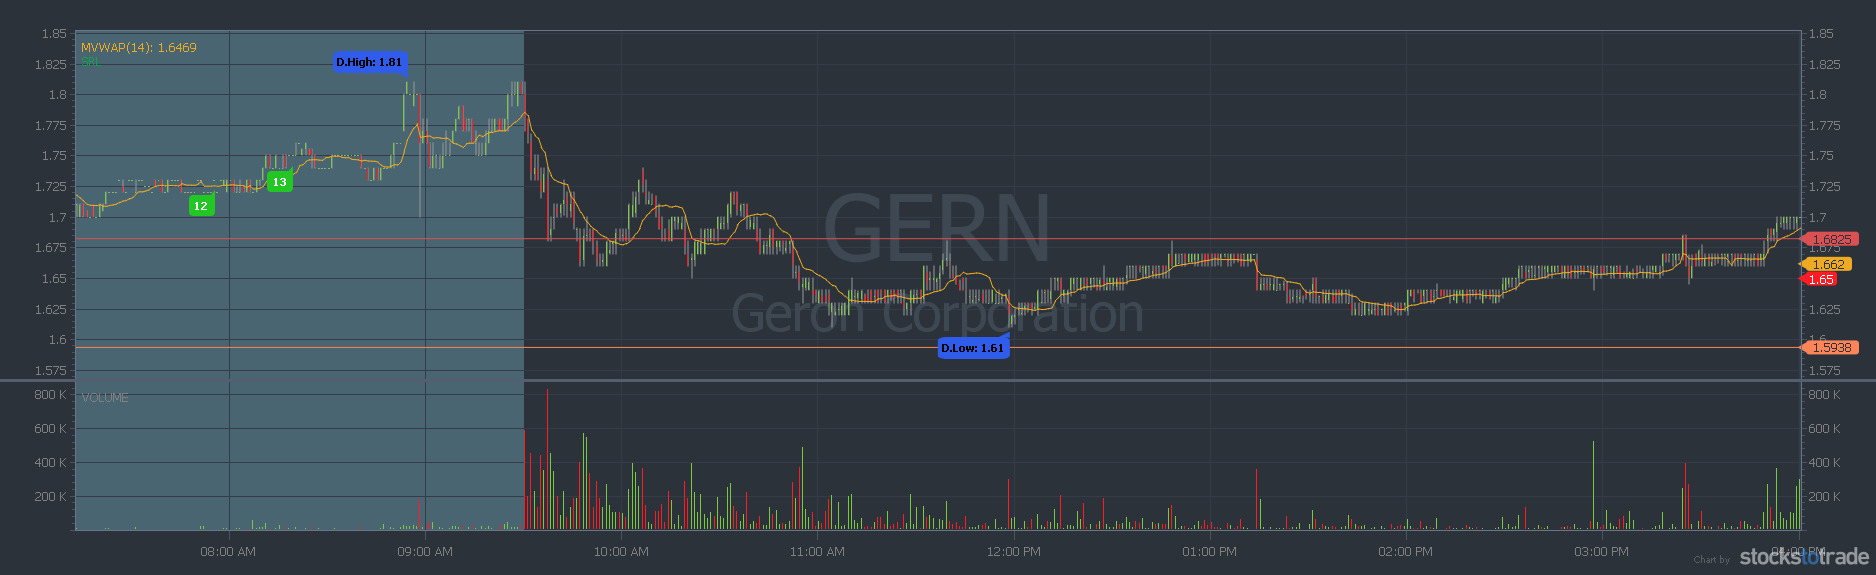
Looking back at the chart now, the volume was pretty low when it had its first two bounces. So I likely would have slept on the first bounce to see if it and legs and then let it go when it was only 5%.
After checking out the charts on $PSWW and $ALF, I decided to drop those two and focus on $TRCH $AEI and $LKCO.
I should have kept my eye on $ALF as it had several great opportunities to make gains.
With $TRCH, I missed a great dip and rip opportunity because I was too focused on the signal that Oracle gave me. Lesson learned. Use your knowledge and the AI.

Since $TRCH was now moving so quickly, I figured that I missed my shot, and it would be smart not to chase.
I then turned to $LKCO, getting close to the Oracle buy signal that followed a small dip n’ rip that followed a dip and a bounce.
$2.66 was right at the bottom of this bounce, and I was ready.
I had prepared my share size and limit price, so all I needed to do was press submit.
I pulled the trigger, perfect execution….so I thought.
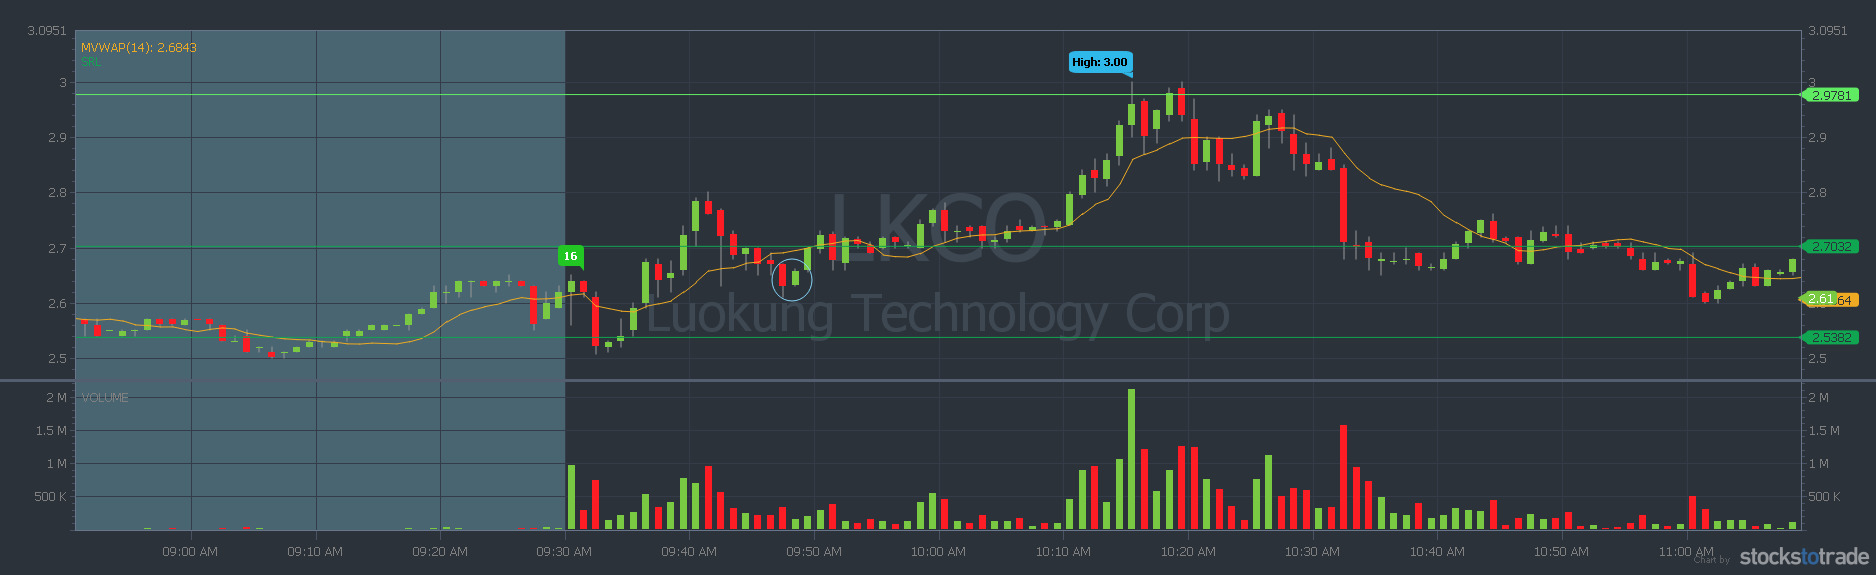
“Error while requesting preview order to the broker: Error while previewing an order: status code: 400, reason phrase: Bad Request (The term you specified for this order is invalid. Please contact Customer Service at 1-800-387-2331 for assistance.)”
Hmm… I try again, changing the term, but the same thing.
Then I noticed that it’s stopped and assumed this must be why E*Trade was blocking the trade and just decided to move on and not let the missed opportunity bother me too much.
I then realize that $TRCH was stopped, so I decided not to bother with it until it came back.
Once the stop was over, $TRCH started to downtrend fairly aggressively.
From 10:15 to 10:20, there was a failed breakout that I’m glad I stayed away from. Learning from my past.
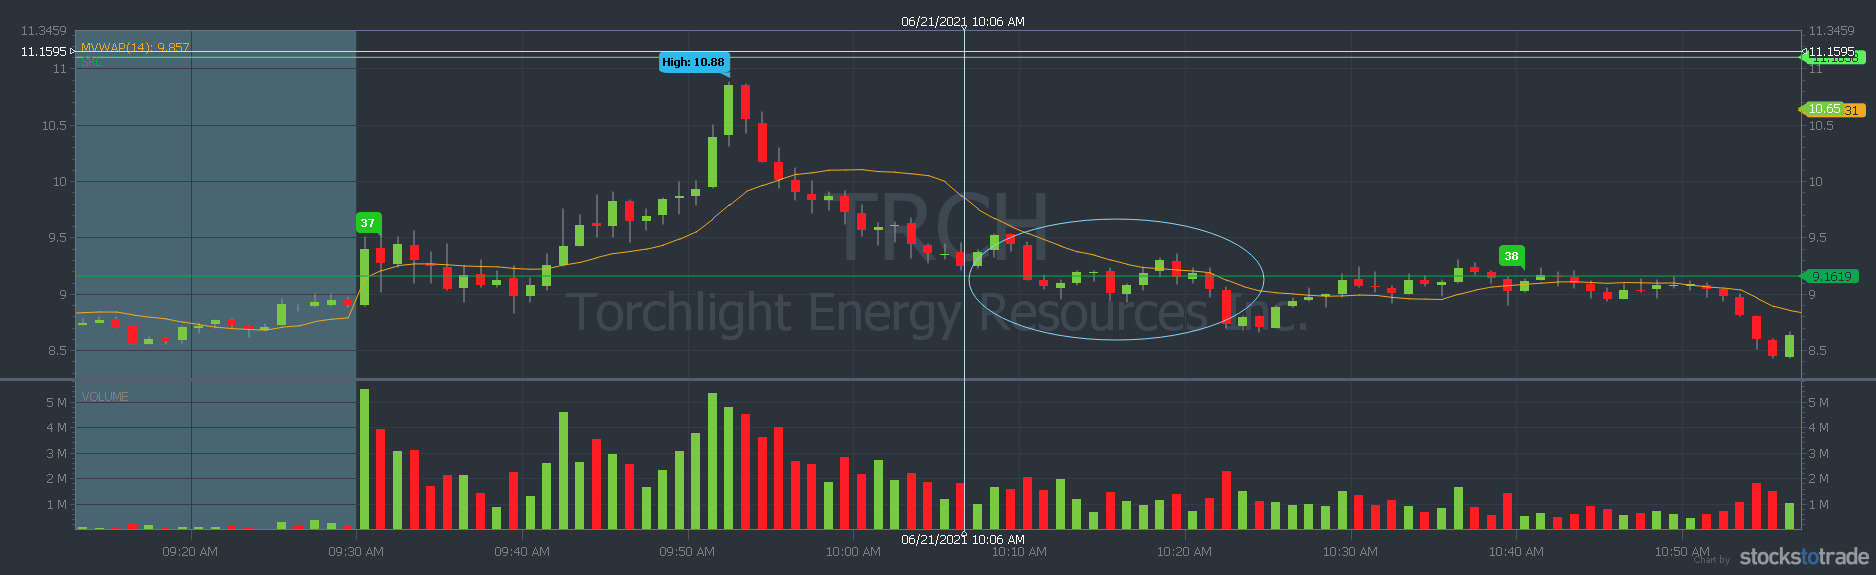
At 10:38, I was hoping for another breakout at the previous breakout price, but it failed. So thankfully, I again waited to see if anything happened before getting a position.
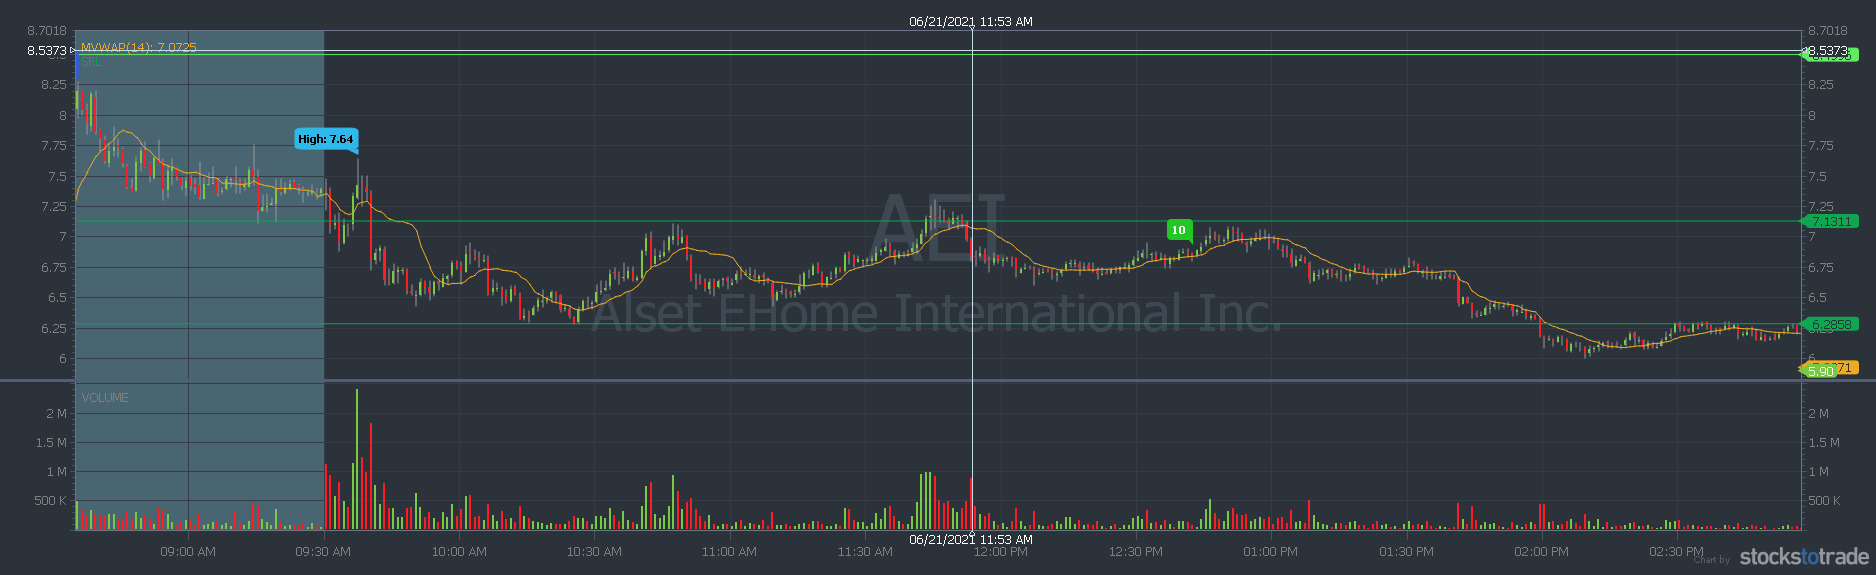
After that, I shifted my focus to the ticker $AEI.
Oracle had a fairly high signal level at $7.48 when you compared it to the live chart when I was viewing it.
While the chart had a resistance level of $7.13, $AEI failed to break $7 after 3 bounces then started downtrending.
At around 12 o’clock market time, I ran one of the Grittani scanners and noticed $GSAT. How did I miss this one before?
The float was high, but the volume and chart were wonderful.
Since I was so late, the chart looked like it could start to turn at any point. So I kept it safe and waited to see if the steady breakout would continue to be convincing.
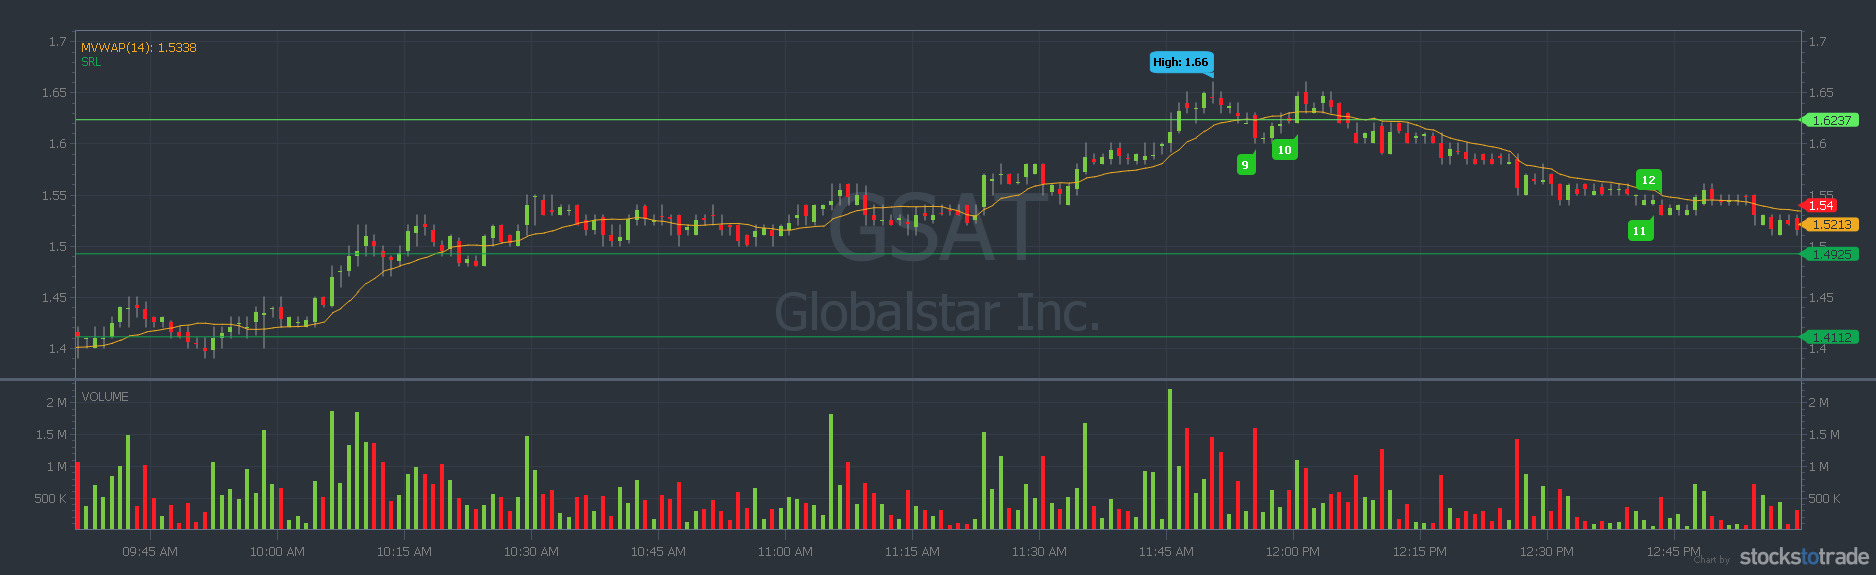
Sure enough, it turned. I made a promise to myself to never buy the backend of the slope unless a cup was forming, so for the last time that day, I stayed away.
Stayed disciplined today. I stuck to my plans, let things go when they didnt pan out, didnt chase if I missed it, and didnt try to force any trades. Learned a lot from the charts and news today. My biggest watches were $LKCO $ALF $TRCH $AEI and late to $GSAT. Happy trading!
— Hemerodrome (@Deliverypennies) June 21, 2021
Over the next couple of days, I could not get any live chart time due to my schedule.
While also studying Tim Sykes videos, I really dove into Stephen Johnson’s videos on youtube that showcases his trading journey weekly.
Below is the first video I saw detailing his trading journey.
I am currently on his Month 9 videos, and I love his channel! He is real with you and provides a wealth of knowledge with some humor thrown in.
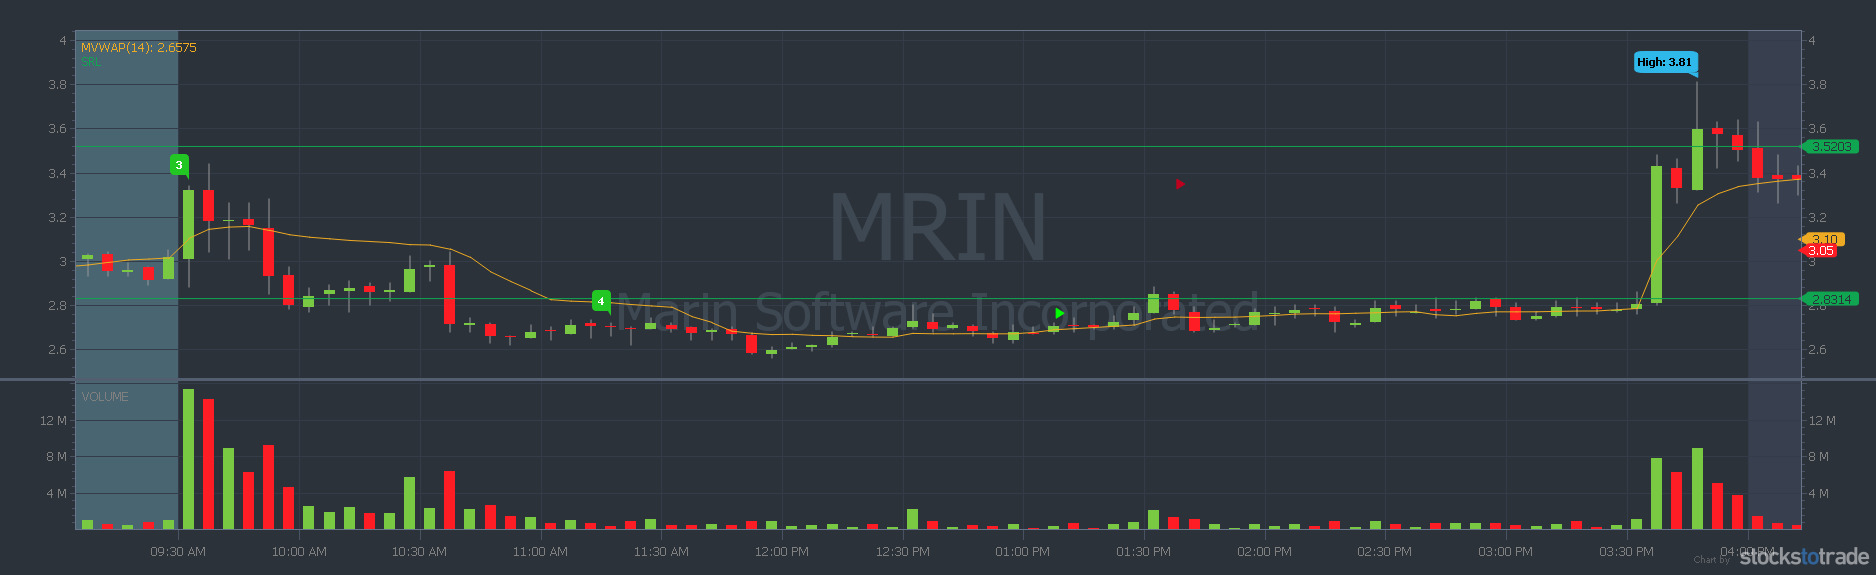
$MRIN
On Thursday the 24th, I had a full workday scheduled with a small gap for lunch around the market close.
I started the day like I usually do (even if I can’t trade), running my scanners and watching the latest video lesson from Tim Sykes with my Pennystocking Silver Subscription, and watching Pre-market Prep with Tim Bohen on the StocksToTrade youtube channel (as of 6/25/21 the PMP videos may not be produced, check out the channel for details).
Bohen first spoke about one of the tickers that showed up on my screener, $MRIN, and how it met all the criteria for a perfect setup to yield great results in a single trade. More importantly, he mentioned that it would likely be in play all day, not just a morning play. Perfect for my market close lunch.
After I finished up watching the videos, I went on with my day.
The morning spike was over in six minutes, and so, like Bohen suggested it would, the ticker had a weak open when compared to the pre-market, which lured in the short-sellers.
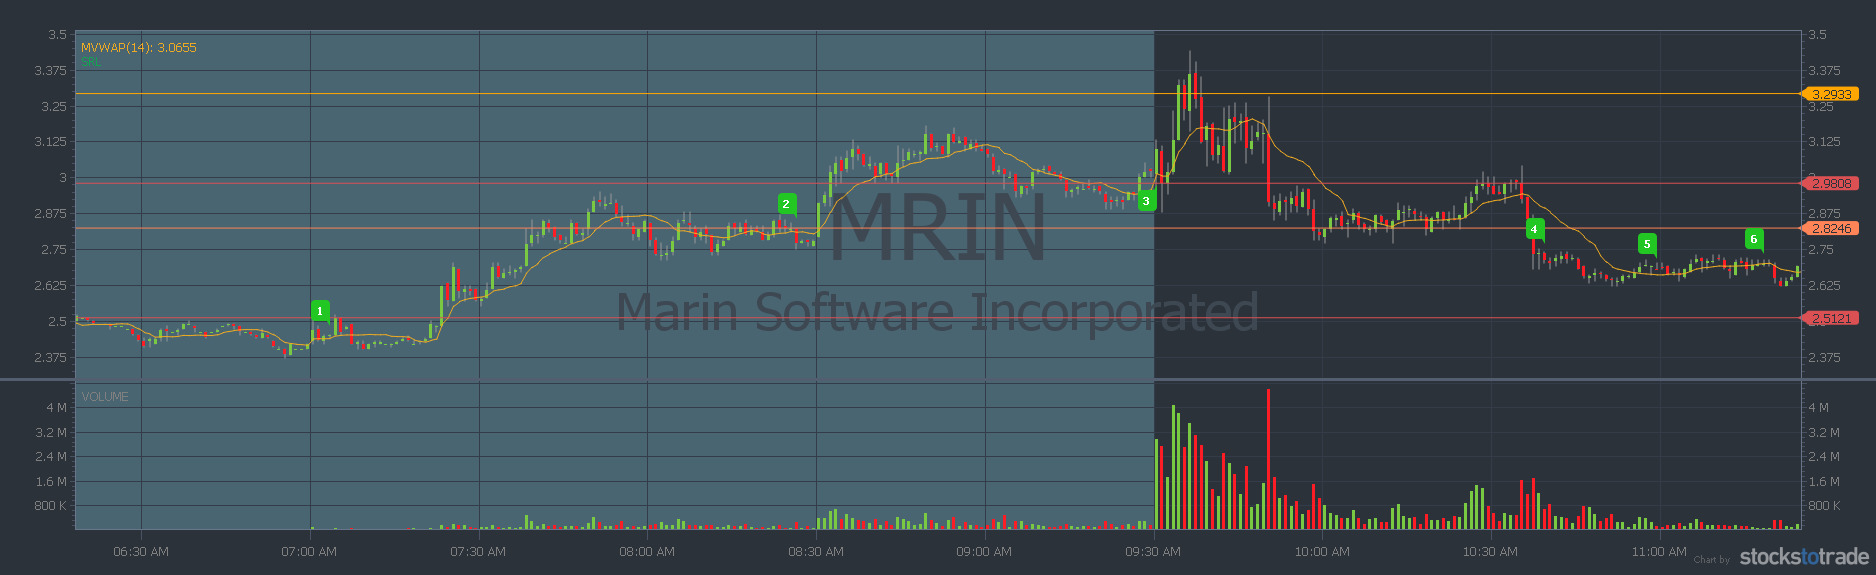
What was important to me was that every time I checked the chart during a break or transition in my day, the candles were holding.
I had it in my head that I would maintain interest as long as it stayed around the $2.70 range and never dipped below for very long before looking strong again.
Not only had it held, but since 1 o’clock, it had begun to trend upward with around a 5% slope, give or take.
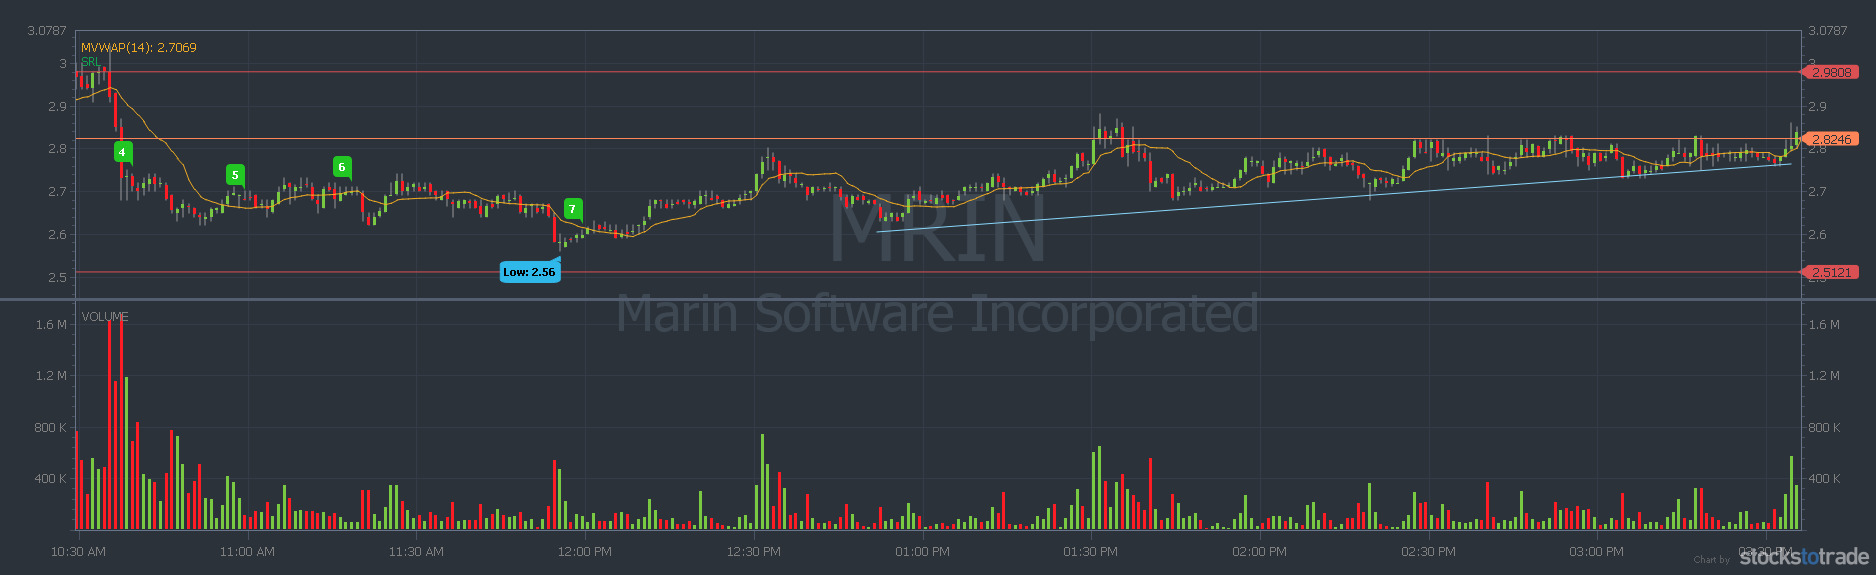
Right around 3 pm market time, I began my lunch break, loaded the StocksToTrade app and my E*Trade app.
After holding strong for nearly an hour, followed by a small dip that immediately bounced back to the previous levels it held at, I figured the candle at 3:04 was probably as low as it was going to go during power hour.
I planned to enter at the next red candle, and If it continued to dip, I would quickly cut the loss.
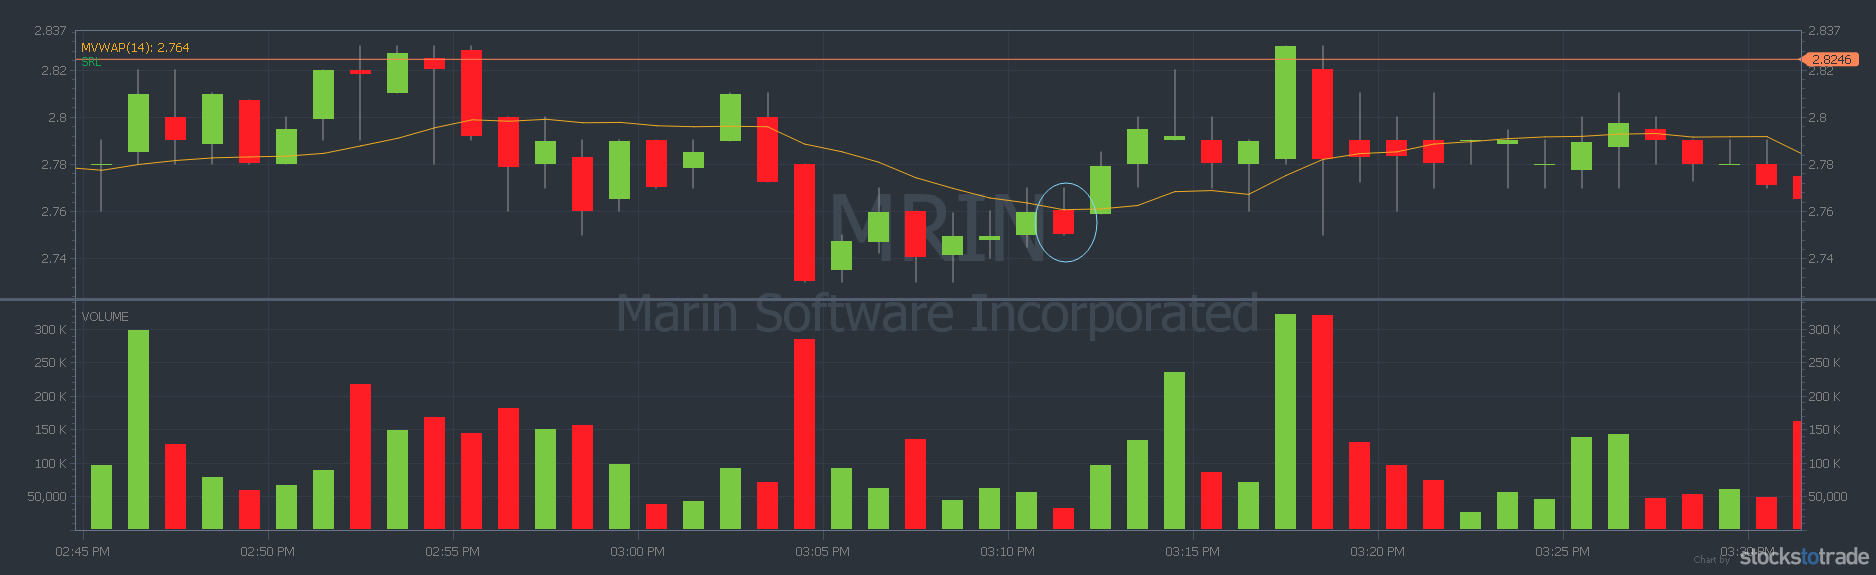
My entry was 3:11 pm market time at $2.77 per share. Thankfully, that was a lone red candle, so I did not have to cut my losses quickly.
Since my entry was so early into the last hour of the market, I knew that there could be some ups and downs over the next hour. That being said, I put on a mental stop of -$10.
Twenty-three minutes after I made my entry and less than a half-hour to close, the volume increased.
Over the next five minutes, the stock increased by nearly 25%.
Learning from my past about how quickly a spike can dump, after the first red candle, I made my exit at $3.35 per share for a 21% gain. Trade is verified on profit.ly.
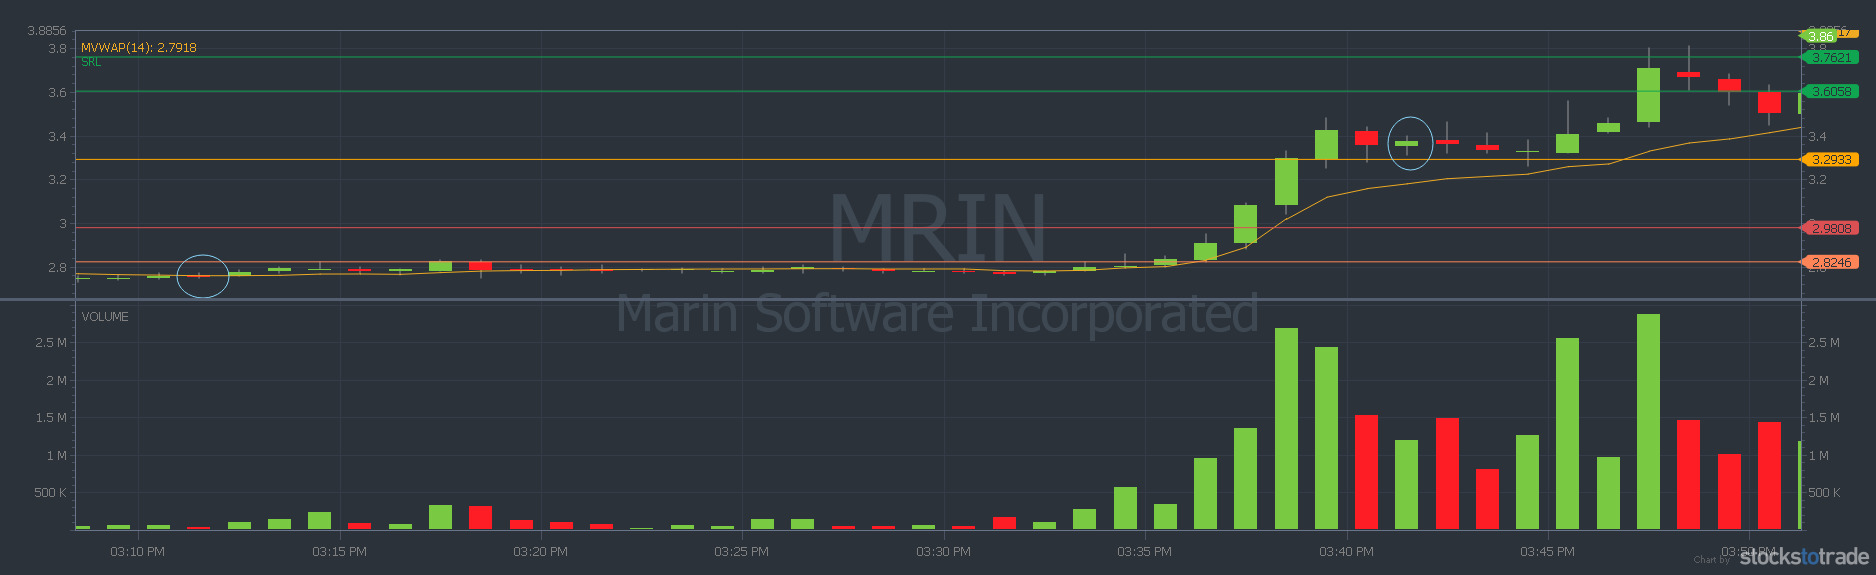
I could not have been happier with how this trade went. The only thing I would have changed would have been my position size. But I played it safe and only exposed $400.
The ticker ended up climbing up another 10%, give or take, so I definitely left money on the table but right now, following systems that lead to success are way more important than gains.
$GRVI
The next day was Friday the 25th. On Fridays, I get to dedicate the first 3.5 hours to the market.
I started the day out like any other with scanners and videos. My top watches for the day were $OSMT$FFHL and $WSRC. $ALF and $WISH were over my price range, but I watched them so I could learn.
I should have also been watching $MRIN for the same play as the day before, but I barely looked at the chart for some reason. So I am adding to my rules to watch tickers I traded the day before for similar plays.
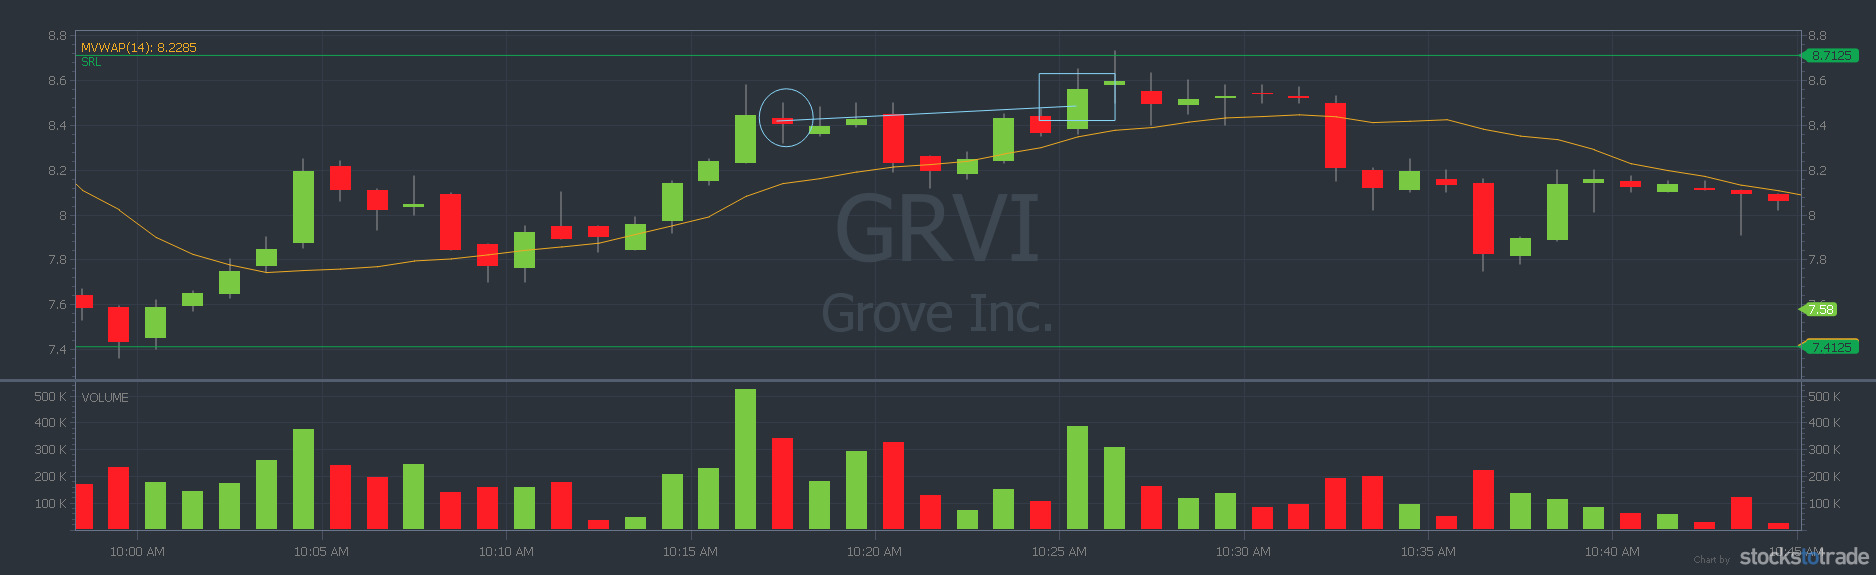
While watching the 5m chart for $GRVI, I started to like how it looked around 12 pm market time.
After it dipped, it had a nice bounce, followed by a smaller dip and another bounce, then another 5m green candle. I thought it would be a good time to enter.
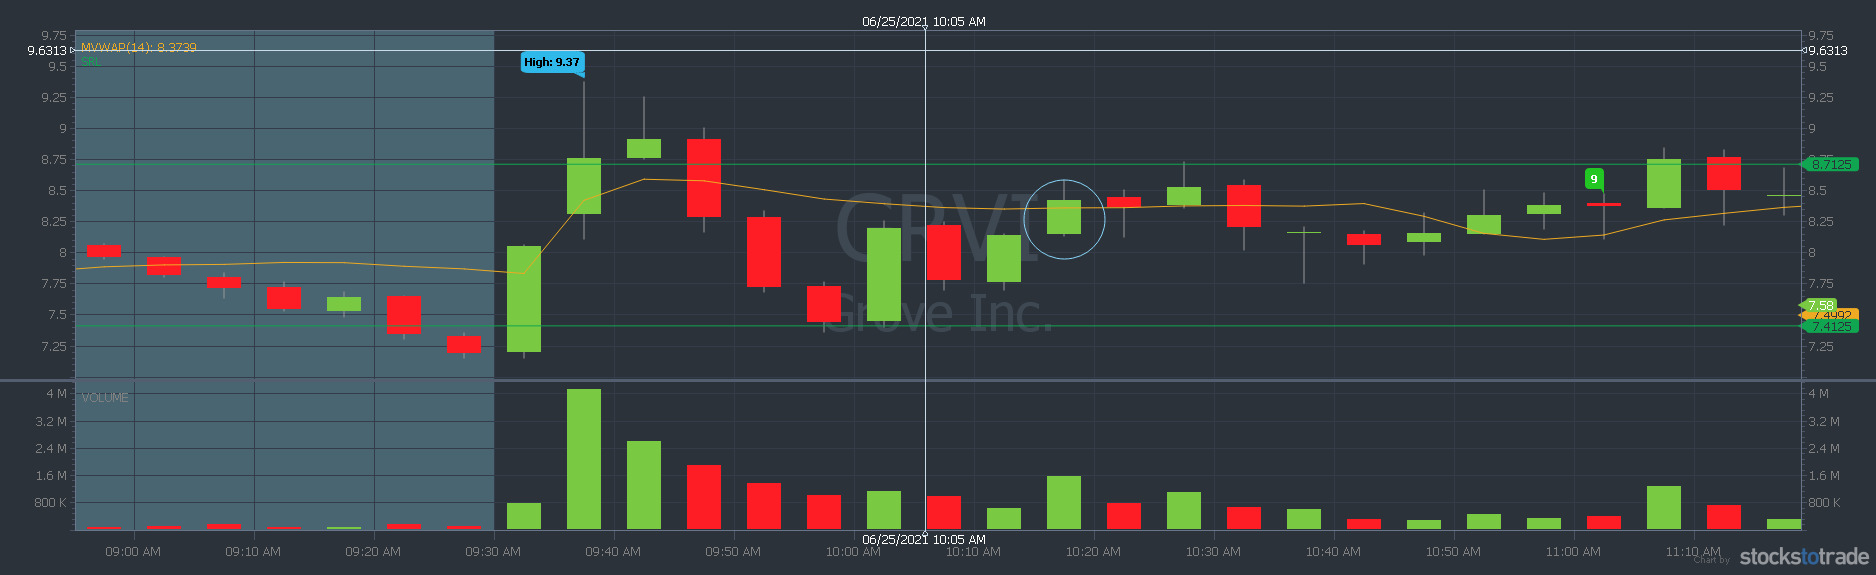
I hoped that it would continue to climb to around the morning spike level or a little bit more.
After my entry at $8.42 per share with the 5m chart, I decided to switch over to the 1m chart for my exit.
Upon doing that, I realized that I had made a big mistake with my entry.

When I switched the chart, I realized that I bought the top of the end of a ‘W.’
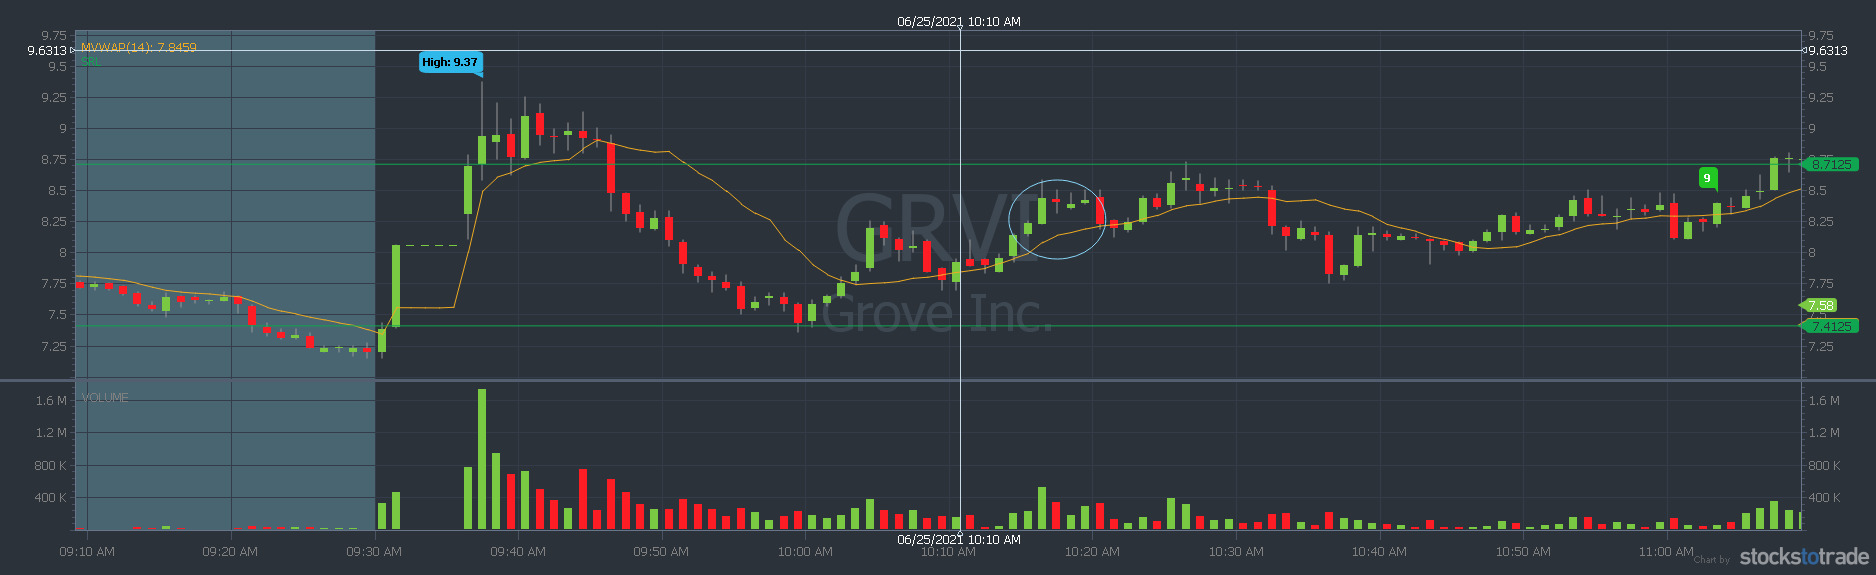
Looking back a the charts, I should have realized this with the 5m chart as well…..
With this ticker being less than a week old, I should have stayed away from it. I know better than trying to catch something before it truly proved itself.
While yes, it did have several buy indicators, it also had a few cautionary flags.
That being said, and realizing that it was not going to spike, I planned my exit.
My goal was to at least break even. At this point, it was starting to dip, but my loss had not gotten anywhere near -$10, so I figured that I should give it a few minutes to recover.
Thankfully, less than ten minutes later, it did recover, and I got out at $8.49 for a less than 1% gain. Trade verified on profit.ly.
It did go up a little more after my exit, but it also dipped hard shortly after. Past me would have stuck that out and taken a major loss.
So while this trade did not work out how I wanted, I was very proud of my discipline and exit.
After this trade, I was all out of settled funds to trade within my cash account, so this ended my week.
Not only did I manage to end the day green, but I managed to end the week green, and I’m on track to my biggest profiting month yet since I started in Feb of this year! (2021)
I’m not on track to my biggest profit month due to making my biggest gains with trades. It’s happening because I am protecting my account.
You can go into any trade with a thesis, but if the price action says otherwise, it's good to listen to what the market is trying to tell you & when a play like $RSHN has 7+ billion shares & a ton of social media promo, it can be un-ending moat of sellers, similar to $GGII $LTNC
— Timothy Sykes (@timothysykes) June 21, 2021
So far, my biggest loss this month has been -$15 compared to last month, which was -$140.
Things are starting to really click, and I am looking forward to continuing to grow the knowledge and broker accounts on my marathon to a million.
Summary
Thanks to sticking to my new plans, my average loss has been reduced by a couple of percentage points, and I’m on track to my most profitable month since I started in February.
I started independently preparing watchlists with tickers top traders ended up having on their watchlists. Working towards full independence.
Tim Grittani shared two of his favorite screeners and their criteria. I added these to my list.
I had discipline and only watched the tickers $LKCO $TRCH $AEI and $GSAT. Each had set-ups that failed to prove themselves.
No paper trades this week.
$MRIN in at $2.77 and out at $3.35 for a 21% gain.
$GRVI in at $8.42 and out at $8.49 for a less than 1% gain.
Thank you so much for taking the time to read about my journey. I would love to hear about your trades and progress in the comment section below!
One Reply to “Week of June 21, 2021: On Track for My Best Month”