Like a red to green breakout, I left the month of May red and gapped up the last 2 weeks of June for my most profitable month since I started getting my feet wet in February.
Compared to my previous most profitable month (April), I made 218.407% more profit this month.
Now that things are starting to work and I understand why they are working, I need to double down on my studies and trading rules.
Let’s dive into the changes I made this month that I think are the catalysts for my best month.
Changes Made
If you want to avoid falling victim to the market and end up like the 90% of traders who fail, you must continually educate yourself and adapt.
During the first two weeks of June, when I could not trade and had little access to live chart time, I got into the habit of watching 2-3 videos in the morning while getting ready.
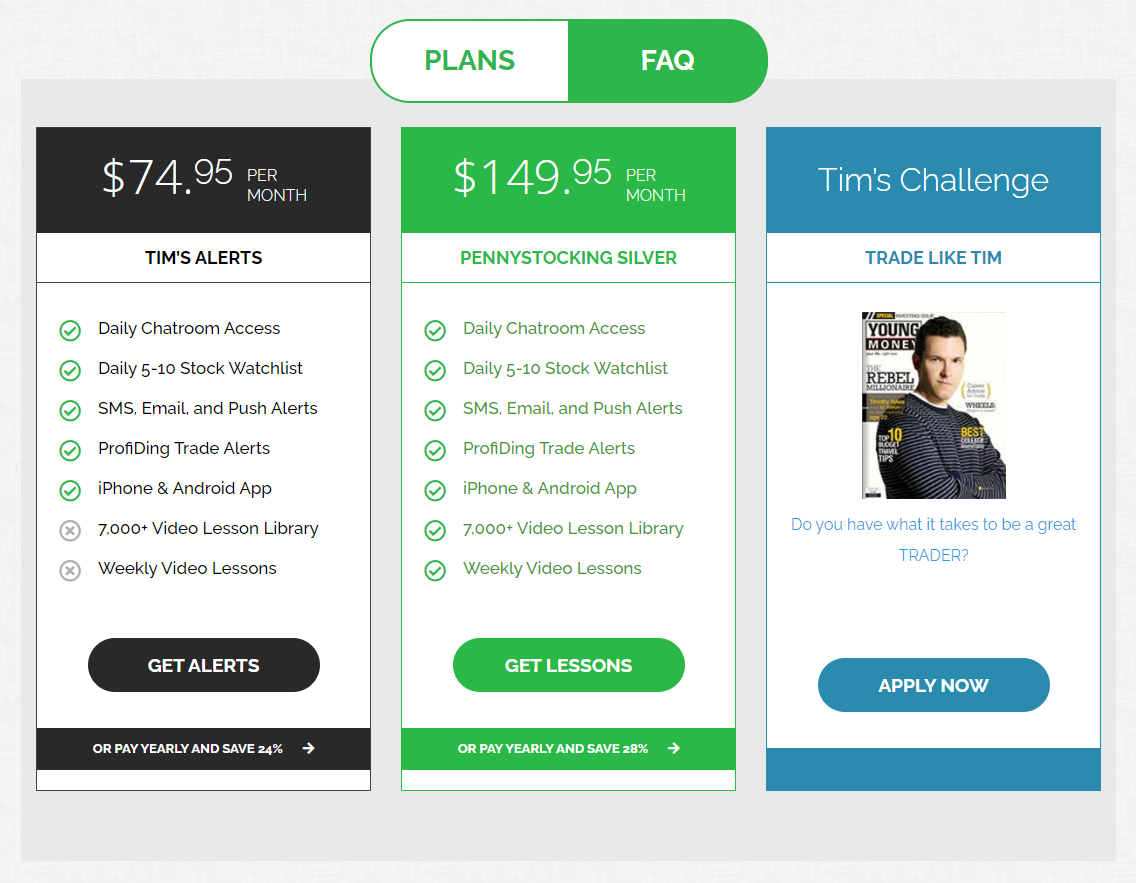
The first video I watch in the morning is a video lesson from my Pennystocking Silver subscription with Tim Sykes. After this video or, if there is no video that day, I move onto youtube.
Once on Youtube, I head the StocksToTrade channel to watch the lead trader Tim Bohen do a live Pre-Market Prep video.
YES! Pre-Market Prep is back!
It’s pointless and a complete waste of time, but if I can save one soul from following the short selling demons on Twitter I guess it’s worth it.. @stockstotrade PMP is back https://t.co/1IyBqoT63T
— Timothy C. Bohen 🇺🇸 (@tbohen) June 29, 2021
If you are trying to learn this game the free route, you absolutely have to be watching every video StocksToTrade puts out.
In addition to watching more videos that pertained to the trading day/week, I added a couple more screeners to my collection to help me find the best end-of-day trades.
All of my screeners were for the first hour or two of the market day until this point.
It’s hard to say which change had the biggest impact, but watching the charts and taking notes even when I could not trade because I had to wait for funds to settle has been huge!
It has enabled me to spend more time working on learning to read the tape, recognize the approximate low end of a consolidation period before it spikes, gave me the confidence to size up, gave me the confidence to trade in the $1-$20 range, and lastly gave me time to watch trades Sykes, Toughey, Mono, and Papa made and dive into the in’s and out’s of their trades live.
It’s more important to push yourself to grow the knowledge account during these first few years than the broker account.

The next change I made that I think made a major impact was journaling about trades the day I make them rather than a few days later.
Yeah, you can jot down some bullet points for later, but you’re not going to remember everything that happened or how you felt during it all. Things that I think are critical.
Tim Sykes is constantly making that recommendation, and it only took me a few months to believe him and a few weeks to see the results.
The next change that made a huge impact and possibly the biggest impact on my improvement was tracking more stats in excel.
You can create any criteria you want to learn about your trading to help you improve your performance. It just takes time to get it set up.
The time is worth it, though! I immediately saw what I was doing wrong, made a plan to correct it, and the result was my best month to date.
I have a free starter journal here.
Here’s a great video by Tim Bohen and Tim Sykes on the importance of a trading journal.
The final noteworthy change I made this month was making it a top priority to stick to my plan when placing a trade.
That means knowing your edge, having an exit plan if the trade goes as expected, and having an exit plan if it goes against you.
When sticking to my plan, I found that I win 69.23% of the time.
Speaking of that, let’s get into my latest trading statistics.
Stats
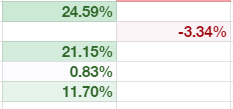
I thankfully only had one loss for the month, so the average dollar loss is -$15.50 or an average loss of 3.34%.
My average dollar gain for the month with four trades was $70.29, or an average gain of 14.57%.
On average, during those trades, $485.10 was exposed.
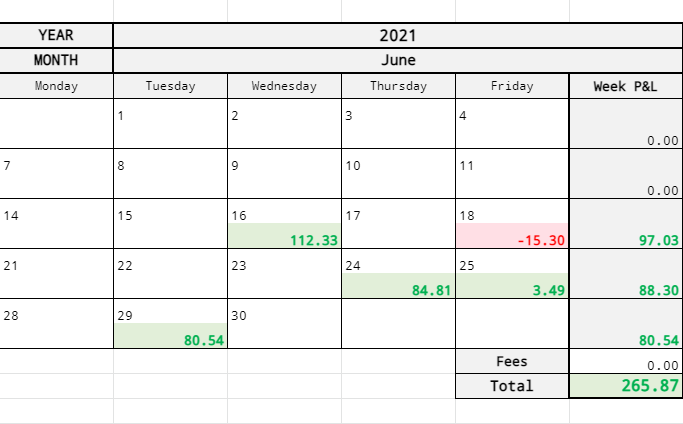
For June, I gained $265.87 in profits.
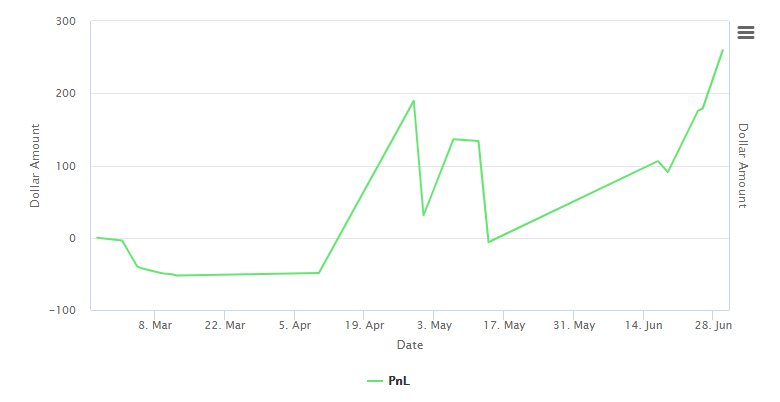
Below is my profit.ly profile profit chart.
One of my proudest statistics is increasing my consecutive green day trades from 2 to 3.
I’ve had 3 consecutive green weeks before, but this was the first time that was 3 back to back, so this was also notable.
My current win rate is 42.86%, with a total of 21 trades, which I am super happy about. If I’m not mistaken, a month ago, I was sitting around 30%.
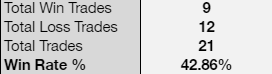
I’ll be tracking the percentage win rate increase or decrease from month to month going forward.
I’ve only just started tracking how many x’s the day’s volume is higher than the 60-day average, but when I win, the average is currently 43x’s. No data on losses yet.
The days float when I win, on average, 37 million. When I lose, the average is 316 million. Lower float stocks are clearly the way to go.
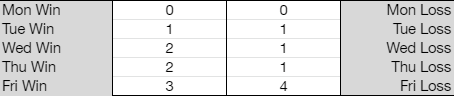
My best day to trade is Friday, but it is also my worst day. This mainly comes down to my schedule. I typically have more time to trade on Mondays and Fridays. Friday’s tend to have more opportunities.
Speaking of setups, my best setup this month was an end-of-day spike, consolidation, and spike pattern.
I love how reliable they are and how simple it is to see if the chart will likely spike or downtrend in the last hour. I would argue that this is one of the safer setups as an early trader.
The Best and the Worst of the Month
While $TRCH was technically my best trade due to being the most profitable, I believe the first time I traded $MRIN in June was my best trade.
$MRIN on Thursday, June 24th, had a weak morning spike followed by a dip that consolidated on an uptrend most of the day. The chart was beautiful, and I was very proud of my entry and exit.
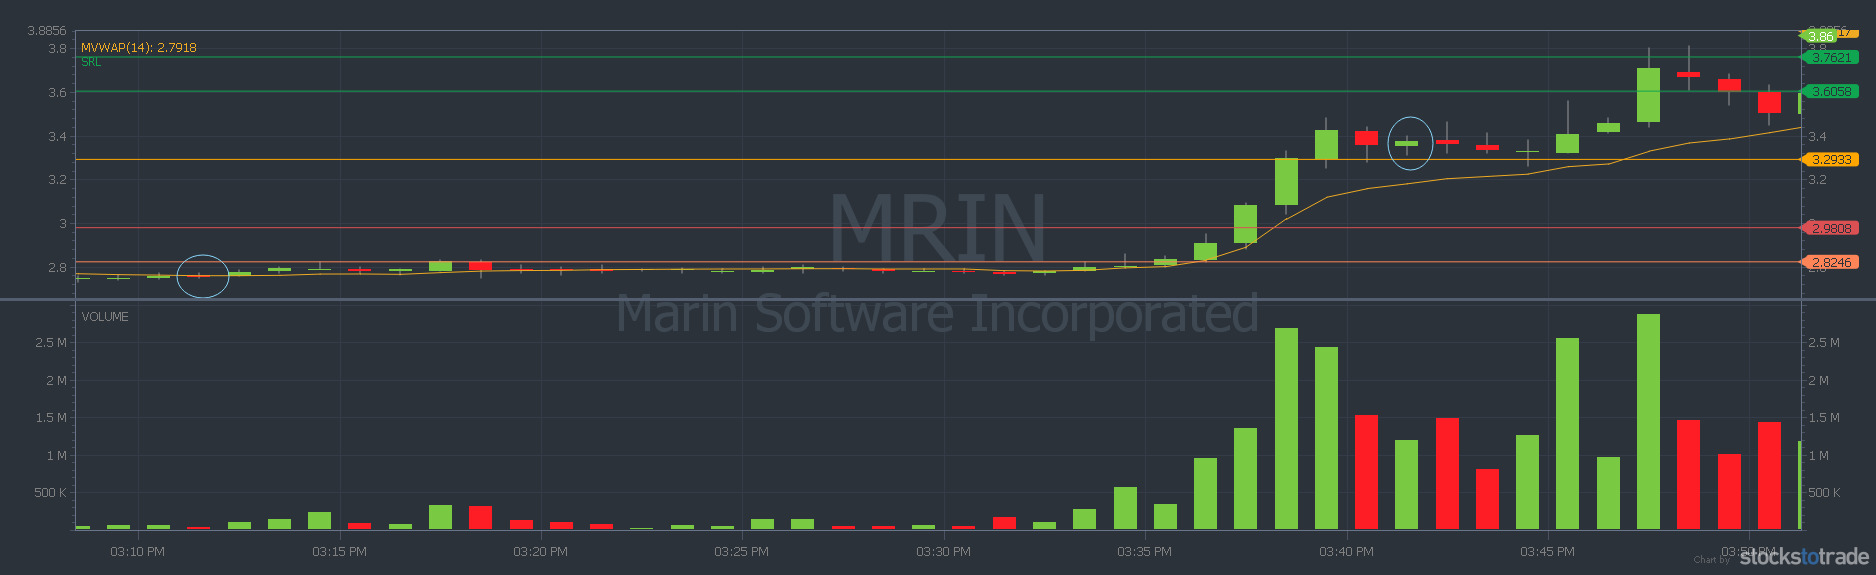
By clicking here, it will take you directly to the spot in my previous blog post that goes over the trade. I got in at $2.77 and out at $3.35 for a 21% gain.
My worst trade was hands down with $GERN.
The ticker had a beautiful run from 8:50 until around 12:30 that I completely missed. I tried to find a play during the afternoon downtrend that did not work out.
I made an entry at $1.98 per share and got out at $1.88 for a 3% loss.
You can read more about the trade here, from a blog post from a few weeks ago.
The Last Week of June
Since I’m already posting a blog going over June, I’m also going to include my last week to avoid creating another post for a single trade.
The morning of June 29th started like any other. I ran my scans and started on my list.
My Grittani scanner and my volume boost scanner gave me the same 6 tickers that also happened to be on Oracle’s list.
My two favorites from the list were $MRIN and $AUUD.
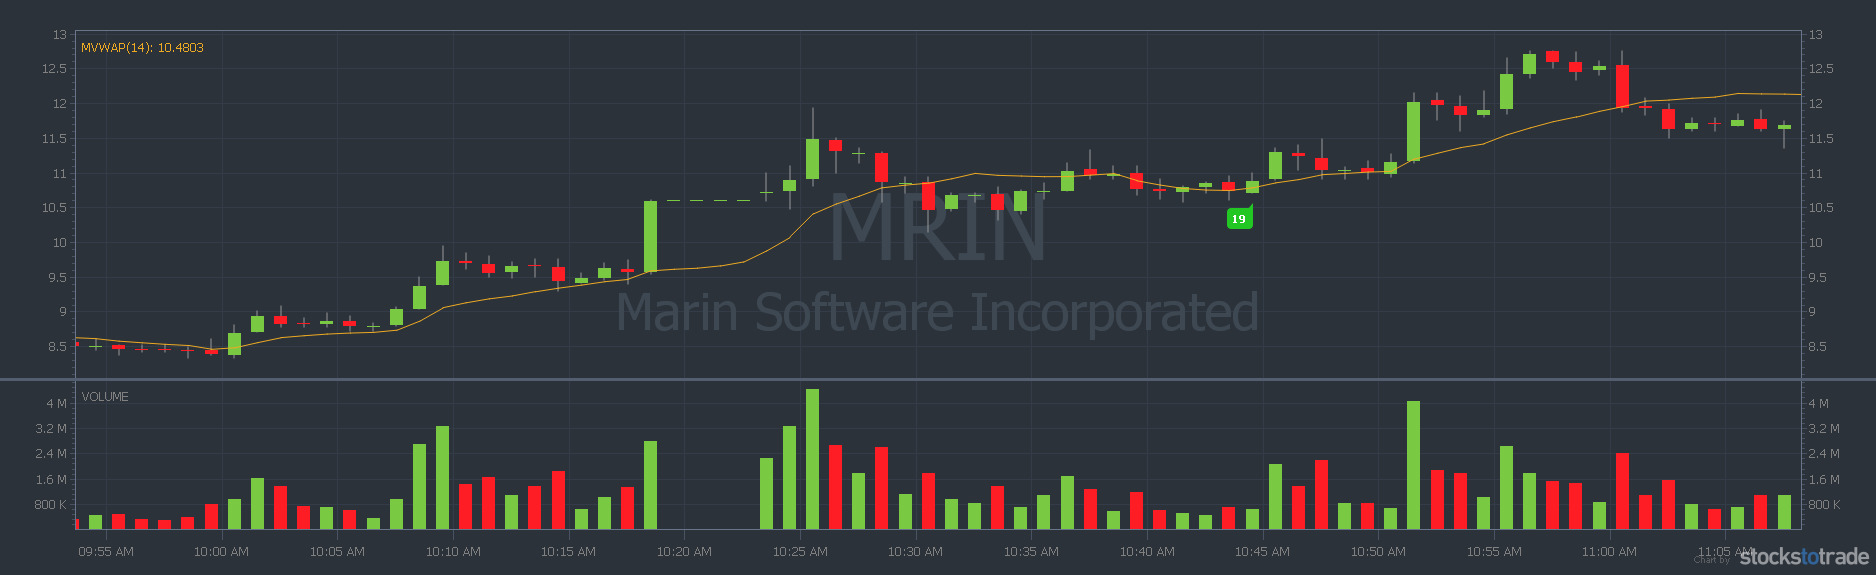
$MRIN had a pretty significant post/pre-market gap up from $6.80 to around $9.80.
I figured with such a large pre-market spike that this would be a great dip and rip play.
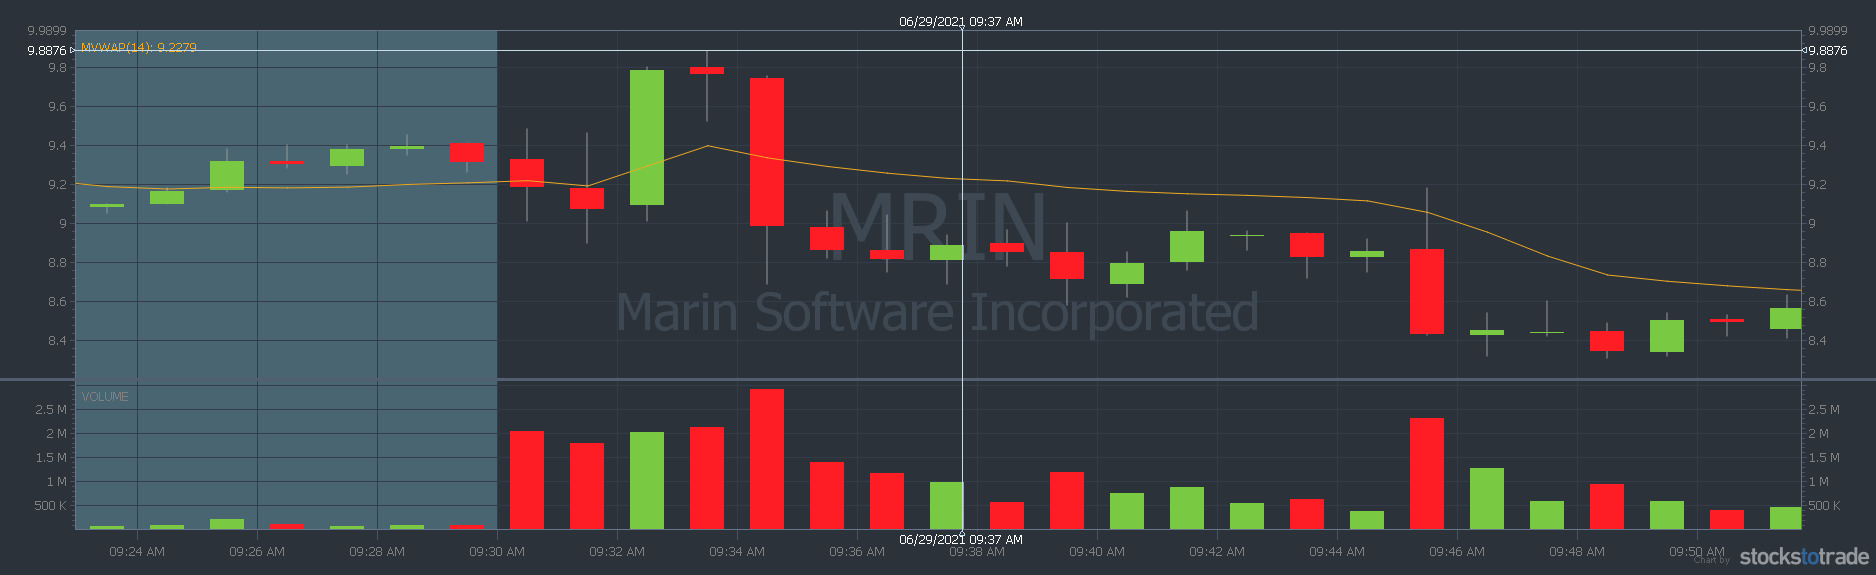
It ended up dipping the first two minutes, then spiking on the third minute, followed by a major dip two minutes later.
After the dip followed a period of consolidation.
During the second green candle, at 9:40 am, I missed my fill for $8.77 per share.
I initially thought that it worked out great because it then dropped down to the $8.40’s.
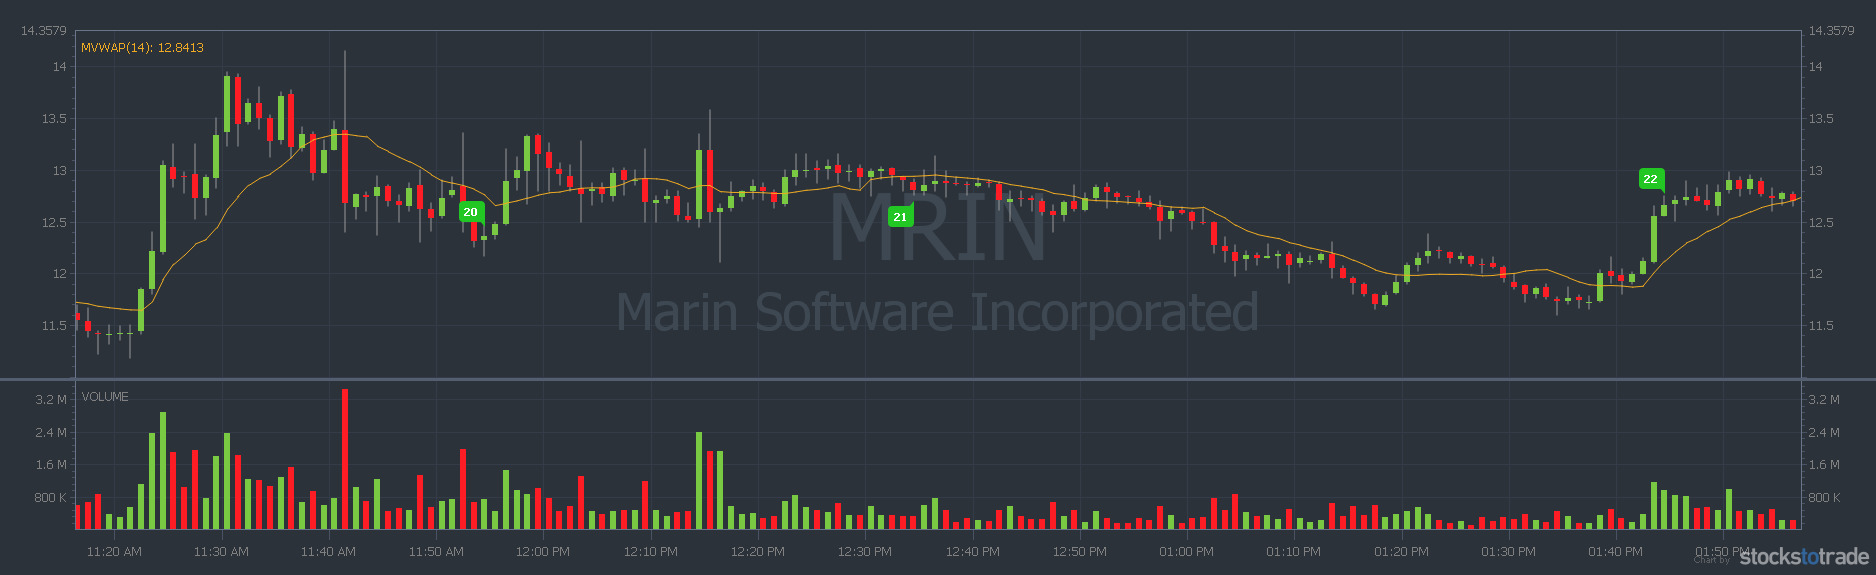
However, that dip was short-lived as it ended up spiking and trending upward over the next 35 minutes.
During that time, I was too nervous to try a make a move. I was worried I would end up buying the top before it came crashing down.
From 10:30 am to 10:45, I missed a great opportunity to buy during a consolidation period.
It was my number one pattern right now, but I was too nervous about making a move for whatever reason. Maybe it was because I was scared to have a red day to end my month.
I ended up watching it climb all the way to the $13.80’s before it started consolidating and no longer had spikes when the candle was green and below VWAP.
I then got ready and headed off to work.
I opened the StocksToTrade app during my lunch break and checked to see how $MRIN was doing.
For the past 20 minutes or so, it was in a healthy consolidation heading into the close.
At 3:15 pm, it looked like it was about to pop again, so I placed a limit order of $15.30 per share.
Three minutes later, it was on a steady uptrend.
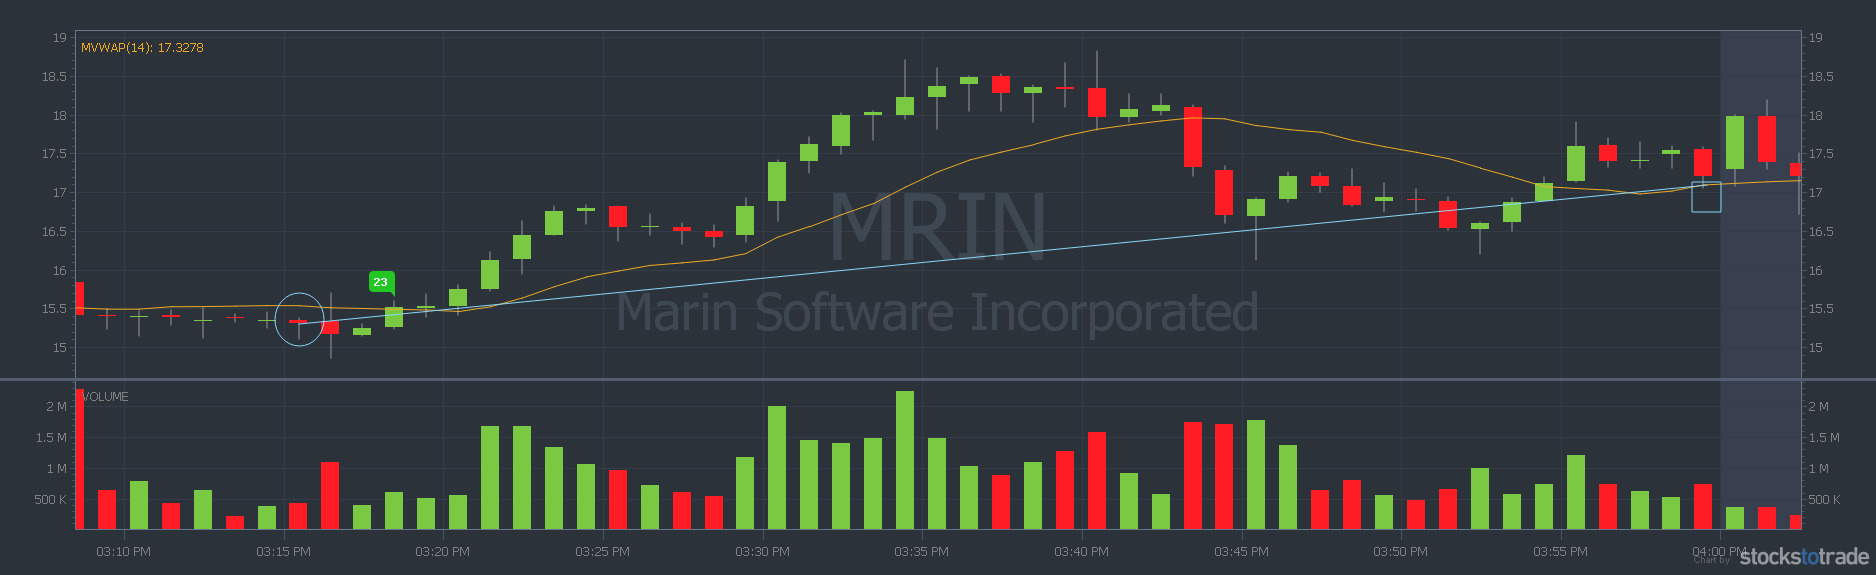
I fell to my greed and didn’t get out when it reached its highs in the $18’s. When I did not get out at that point, I should have gotten out when I had its first few red candles.
After contemplating if I should hold overnight, I got out one minute before the market closed at $17.09 per share for an 11% gain. Trade verified on profit.ly.
Getting out ended up working out perfectly because it started down-trending the following day, where I certainly would have sold for a loss.
There is just no way I would have held hoping that it would start spike again.
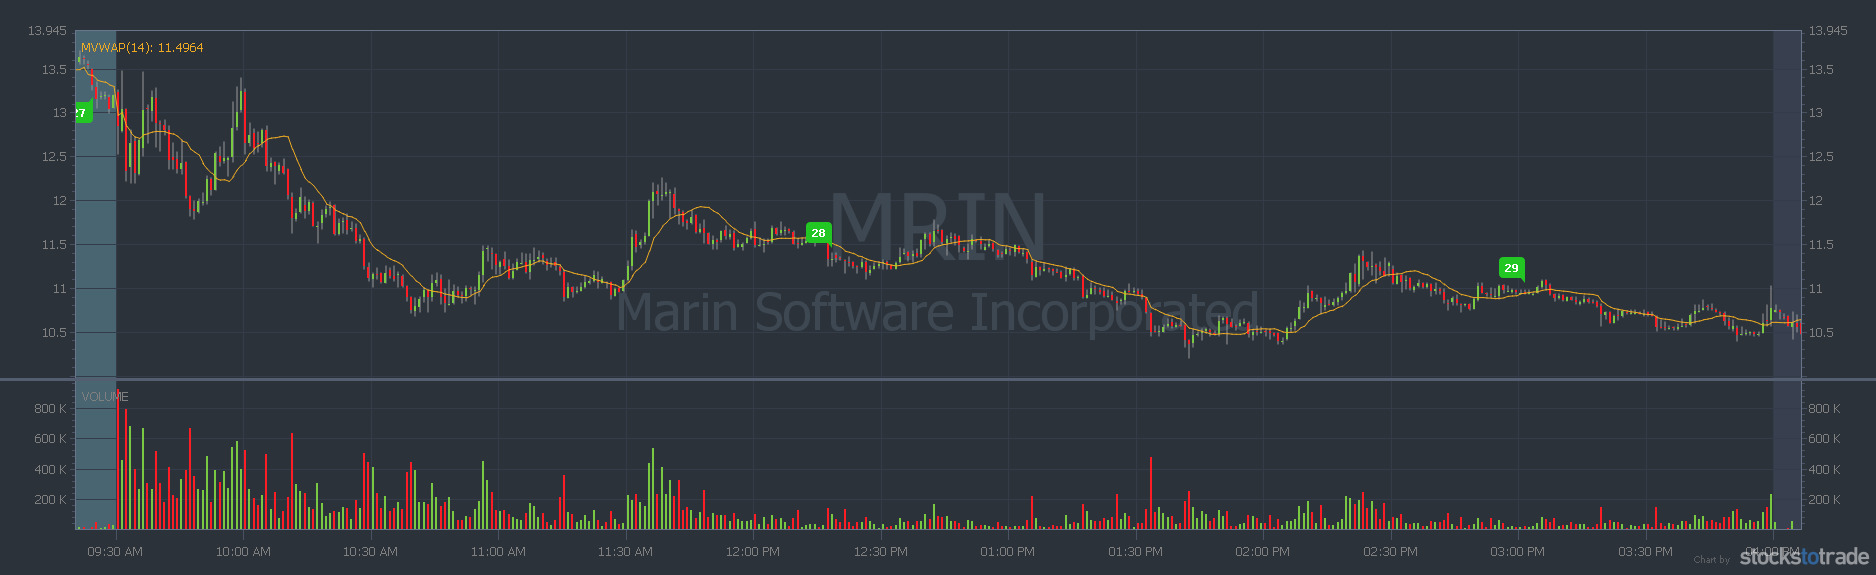
I honestly (and mistakenly) thought that after the chart on the 30th, it would be on its way back t the $5’s. It’s currently in the $20’s.
The 29th ended up being my last trade of the month and the last trade of the week as I fell ill.
This was by no means was a perfect trade, but it’s a trade that I would do again. Hopefully, next time, more intelligently.
Goals for July
Besides the obvious goals like improving my entry and exit strategies and, of course, increasing my profits for July, I have a couple of new goals.
The first goal is that I would like to trade at least twice a week every week.
I can easily do this without forcing trades; I need more confidence to pull the trigger before passing me up, and I consider them a missed opportunity.
The second goal I would like to achieve is nailing dip and rip set up in the first 30 minutes of the market open.
To avoid wrecking my account, I will likely practice making paper trades with StocksToTrade. If I only achieve this goal with paper trades, I will still consider it a win.
Then I will start using real money.
The final, most crucial, and easiest goal to achieve is setting up a chart wall.
A wall with printed-out charts next to my screen with the best setups to play, the ones to avoid, and charts I’ve traded that could have been better with annotations.
Other successful traders have mentioned this being very helpful during their first few years.
Summary
During June, I surpassed my previous most profitable month by 218%.
I added more screeners to help me find setups that are later in the day.
Increased my screen time even when I could not trade due to unsettled funds.
I started tracking more stats in Excel to dive even deeper into my trades.
My best trade of the month was the first time I traded $MRIN for a 21% profit.
My worst trade for the month was with $GERN when I took a loss of 3%.
I set 3 main goals for July: 2 trades/week, nail the dip and rip setup, and create a chart wall.
In June, my last trade was with $MRIN again, in at $15.30 per share and out at $17.09 for an 11% gain.
Thank you so much for taking the time to read about my journey during June! I would love to hear about your on Twitter or in the comment section below!