Man o’ man, where has the time gone!? It’s been about a month since I made my last post.
To those of you that were expecting a weekly trading blog but stuck around during my gap, thank you so much!
My schedule got a little crazy for a few weeks due to summer being here, but I’ve managed to get my schedule changed to guarantee me a couple of hours in the morning to trade on Monday and Friday.
Of course, if I have any gaps in my day, I will try to get in front of some charts. If I can’t actively watch the market, I’ll grow the knowledge account through books and videos.
Alright, let’s jump into how I wrapped up in May 2021.
My last trade ended up being $PMBY on the 13th of May. As you may have already seen, I took a $140 loss with that trade which brought my total for the month to -$37.53 with 3 trades.
The month before, I only made 3 trades, but I ended the month up $85.
I don’t believe that April was better than May because I performed better. I think luck was more on my side.
When reviewing my trades, I realized that my risk level was far too high.
My average gain for the year is 24%, but my average loss is -34%.
While I’m still up around 40% for the year, fixing my risk levels is crucial to maximizing my account growth.
When discussing his early risk levels as an entry-level trader on the SteadyTrade Podcast, Bryce Touhey had the right idea.
His risk level was $2-3, which is amazing and probably one of the greatest ideas ever.
I honestly believe that it’s 10x’s better than trading with $5 and trying to learn. Trading at this low level never lets you truly grasp risk levels.
If you review my profitly, you’ll notice I had several sub $10 losses around the -50% range.
That large loss didn’t hurt and didn’t mean anything until those losses turned into $100 at a time.
That being said, I plan to set a risk of -$20 for the next several trades, if not weeks, until I’m trading more efficiently and my loss average drops.
The reason I am going with -$20 is due to the OTC commission fees, which have typically been over $12 after I’ve exited a trade.
I did do some paper trading in May after my big loss.
The first one was on May 18 and was truly, and fun practice run even though it was at a loss.
I traded $EEGI to catch the morning spike. My entry was late and close to the top, so I had to exit as quickly as possible.

While the paper trade didn’t go as planned, I was proud of my discipline at cutting the loss quickly.
In at 0.0067 and out at 0.0059 for a 12% loss. All paper trades verified on HemerdromesPaper profit.ly.
My next paper trade was with the ticker $CERC using my favorite spike, hold, spike chart pattern.

I was in $2.53 and out at $2.57 for a tiny 1.5% gain. All paper trades verified on HemerodromesPaper profit.ly.
Getting the extra practice with the pattern was great and even more welcomed with the win.
After the 20th of May, life got hectic and took away from my live chart time.
Just because I couldn’t trade didn’t mean I wasn’t still growing the knowledge account. During this time, I ramped up my video study and really dove into my history.
I love profit.ly, but I love personalization more, so I spent about a week working on an excel file trading journal to give me a deeper look into my trades and patterns.
Week of JUNE 7
As quickly as May ended, June arrived and started chugging along quickly.
My first day back to live charts was on June 7th, and thanks to my new schedule, I had 3.5 hours dedicated to watching and paper trading.
Yes, just paper trading. Since I was gone for a few weeks, I wanted to start risk-free to avoid doing something reckless.
Shortly after the market open, I missed a great dip and rip opportunity with the ticker $AHT.
Since I was just paper trading, I broke one of the golden trading rules to get back into the swing of things and blindly followed an alert on the SCR chat.
Not totally blind, I mean, I did spend a few moments to see if the setup was one that I recognized.
Anyways, the ticker was $HMBL, and the setup was a bounce after a downtrend. I was shooting for a 10% gain before getting out, but the market had a different opinion.
I got in at $1.63 and out about 15 minutes later after the breakout started to fail at $1.68 for a 3% gain. Trade Verified at HemerdromesPaper on profit.ly.

Two minutes after entering my paper trade with $HMBL, I entered another one with the ticker $LMNL. This trade was also following an alert from SCR chat.
This trade was a potential dip and rip off the morning high. Due to following an alert, I was a little bit behind with my entry.
I got in at $5.95 and got out just four minutes later at $6.11 with a 2% gain after cutting my losses when the chart started going sideways with a slide downward slope. Trade Verified at HemerdromesPaper on profit.ly.
Being gone for several weeks and making these paper trades created a shift. I realized I didn’t need to box myself off to just sub $1 OTC plays.
The same moves happen in the $1 – $10 range and are actually a safer bet during the current market.
The next day was June 8th, and I only had 30 minutes to watch the market while getting ready for work.
Since I didn’t really have time to look at screeners, read through the SCR or Pennystocking Silver chat, read watchlist emails from Tim Sykes or StocksToTrade, watch pre-market prep with StocksToTrade or a video lesson from Tim Sykes, and since I didn’t bother to prepare since I knew I had to work, I gave Oracle a look.
One of the tickers that caught my eye on Oracle was $SONM, and after watching it play out, I realized that Oracle made a perfect call.
Looking back through my notes, I realize that I failed to write down what Oracle recommended and/or take a screenshot. I did tweet the chart, though.
$SONM Didn't trade since I'm getting ready for work but I'm watching to grow the knowledge account. Oracle on STT made a perfect call. pic.twitter.com/ZDUWkfPyct
— Hemerodrome (@Deliverypennies) June 8, 2021
On June 9, I felt like I was ready to start trading with my real account again.
I tried looking for a dip and rip opportunity shortly after the market opened with the ticker $AEHL, but unfortunately, it kept dipping once the halt was over.

That morning spike ended up being the only long opportunity for a decent return. The ticker has continued to dip since the breakout 52 week high.

After watching $AEHL fail to break out again, I turned to one of my screeners and noticed that $GEO had made some great moves.
$GEO Man this has been a great run! Not going to chase it but glad I got to grow the knowledge account. pic.twitter.com/k8CFW0G7na
— Hemerodrome (@Deliverypennies) June 9, 2021
Thankfully, I stayed disciplined and did not chase the move because it quickly dropped 20% shortly after noticing it.
Due to schedule changes, my trading week ended there.
Week of June 14
On June 14, I ran the Dip and Rip scanner on StocksToTrade at 9 am.
The ticker that caught my eye was $MDIA.
When reviewing the 6-month chart, it was evident that $MDIA had spiked 5 to 6 times since then.

The 2 months chart was mostly green with a steady climb.
On the morning of the 14th, it had made some major premarket gains. In fact, SeekingAlpha mentioned them in an article that morning about leading premarket gainers.

I also really liked the float size, which was at 1.45 mil at the time.
While looking for more confirmation that this ticker could be a good potential trade, I noticed it showed up on the Oracle scanner.
Oracle suggested that the resistance level was $6.20 and the signal to buy was $5.73 for a 9.08% max gain.
At 9:52 market time, it made a jump that was nearly 20 cents up to $5.64 per share. I wanted a more convincing volume before making a purchase.
Also, I’ve learned from my past not to buy the first green candle even if it makes a big jump.
When the ticker got close to Oracles signal, it started to downtrend.
I waited a bit to see if it could bounce back after maintaining the channel from 10 to 10:10, but it ended up dipper harder.

There ended up being opportunities with this ticker later in the day, but I had already moved on.
If you do not already have a dip and rip screener built and are curious, I recommend this video from the lead trader on STT Tim Bohen.
When I didn’t see any trades that I wanted to make, I went on a couple of errands, and of course, that’s when one of the other tickers I was watching earlier made a move.
Over the course of an hour, $DPLS made a beautiful 10%+ move that I would have loved to have been a part of.

When I came back from my errands, I had to get ready for work, concluding the 14th for me.
On June 15th, I did not have any time to watch the charts in the morning, but I’m always trying to learn at any opportunity that I can.
That being said, during a mid-day break, I checked the StocksToTrade app to see what the biggest % gainers were on the day.
The top two listed on the app were the tickers $ALF and $TRCH, which were over 40% on the day already.
After checking out the charts and imagining where I would have hoped to have made a play, I went back to work.
About an hour or so later, my schedule changed, and I now had a large gap in my day. With this gap, I headed home to get on StocksToTrade.
I rechecked the app and noticed $TRCH seemed to be moving with $ALF, which had recently started popping in the last 30 minutes.
I was hoping that that would mean $TRCH would have the same pop. It did, but I missed it while getting home.
I’m not hardcore enough to drive and trade HAHA.
When I got home, I figured that I had missed my chances with $ALF, so $TRCH was my best bet since it seemed to be following.
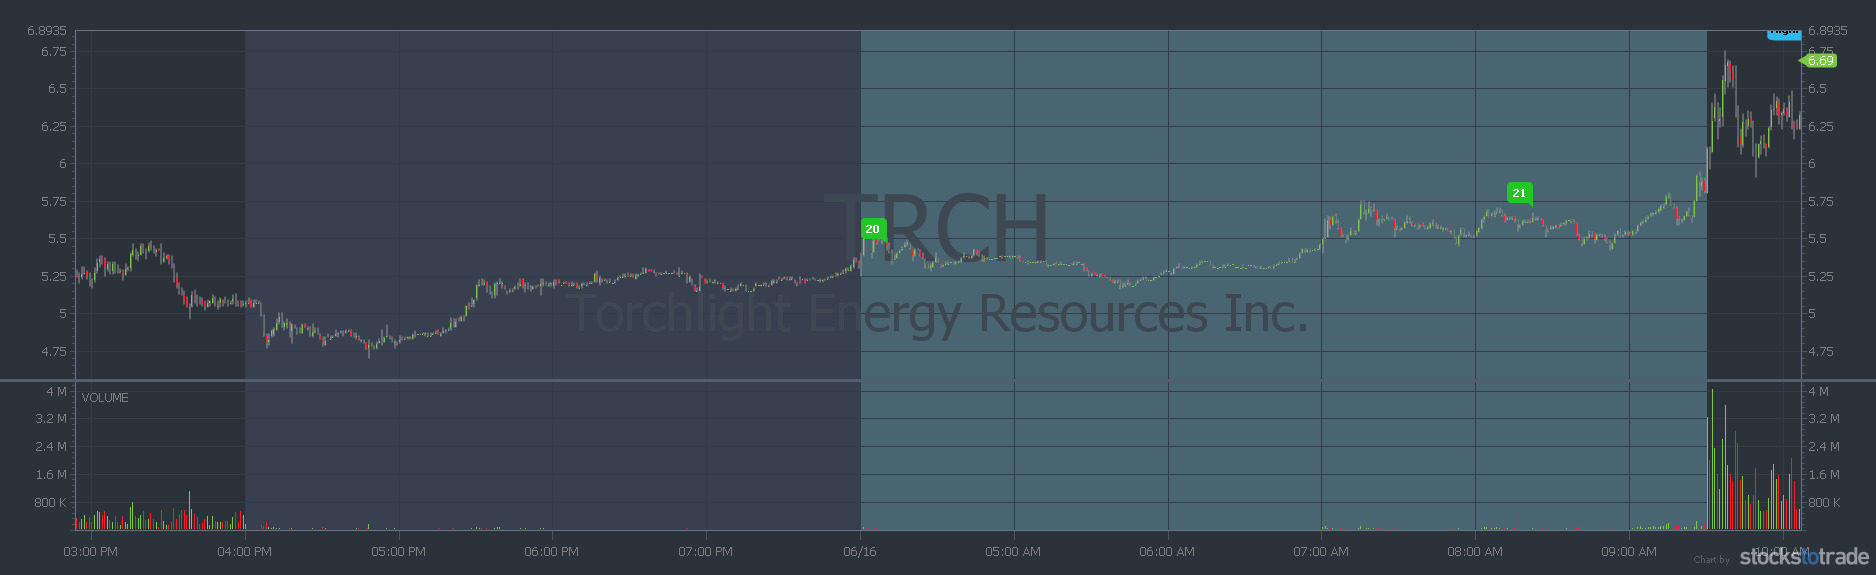
Hindsight is 20/20, and I should have gone with $ALF as it spiked into the close, which is what I was hoping for $TRCH when I entered 13 minutes before the close at $5.075
The ticker started going sideways, and instead of selling at break-even, I decided to hold overnight in anticipation of a morning spike.

A couple of hours after the market closed, $TRCH was trending on Twitter, and the ticker had already gone up over 20 cents during aftermarket hours.

This was confirmation that I would be selling into strength the next morning.
When the morning of the 16th rolled around, my plan was to get out as soon as the chart looked like it might turn to make sure I maximized my profits.
With my overnight play with $RETC a while back, I left $140 on the table because I waited too long and sold on the back end.
This time I executed my exit perfectly and got out 2 green candles before it started to turn. I could not have been happier with the way this trade went.
I entered $TRCH on 6/15 at $5.075 and exited on 6/16 at $6.3232 for a 24% profit. All trades are verified on profit.ly
After that win, I got ready for work.
On the 17th did not have much time to watch the market before work, so I turned to Oracle again.
The one that caught my eye on Oracle was the ticker $CLSD.
Oracle suggested that the signal to buy was at $5.46 per share with a max profit of nearly 10% and resistance at $6.36 per share.
Sure enough, the ticker started to spike at $5.12, and had you bought at $5.46 like Oracle suggested and were lucky enough to sell the top, you could have made 10%.
$CLSD just watching while getting ready for the day job. Oracle on @stockstotrade nailed the buy signal! Growing the knowledge account pic.twitter.com/qWE5xrW0vB
— Hemerodrome (@Deliverypennies) June 17, 2021
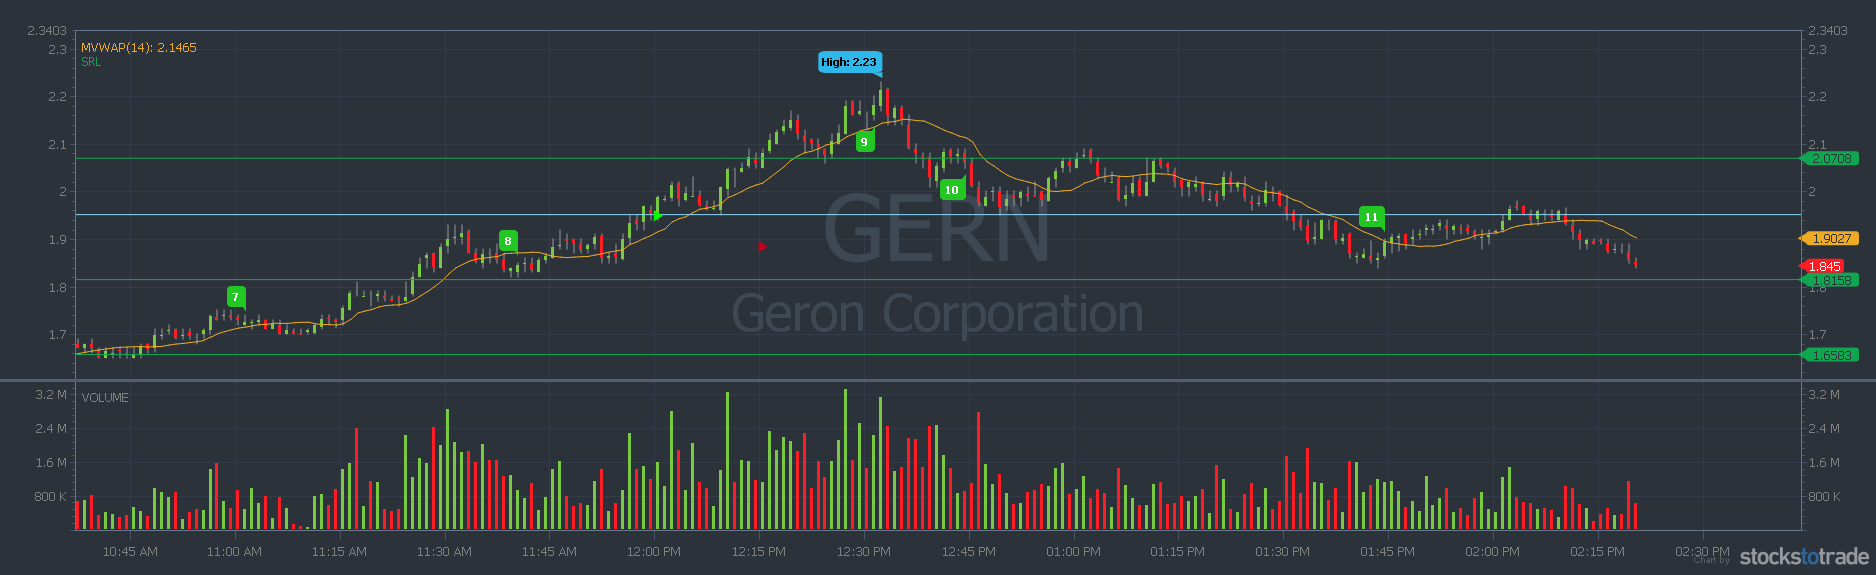
On June 18, the ticker $GERN had a beautiful run that lastest for about half of the day.
I noticed it when its high was in the low $2s.

I figured that since it had been running all day at this point, it was bound to start down-trending soon. So I waited.
About 15 minutes later, it reached its high of the day at $2.23. Then it started to down-trend.
After I missed the meat of the move and after the down-trend formed into a channel, I thought it reached a point where it would bounce and then spike.
The market decided otherwise, and the breakout ended up failing.
I should have gotten out once I realized it wasn’t moving, but I changed my stop loss to -$20, which I feel is safe and allows the ticker a chance.
I entered $GERN at $1.95 and exited at $1.88 for a 3.33% loss. Trade verified on profit.ly.
Even though this trade was a loss, I was very proud of my discipline in sticking to a plan.
Since my last blog post, I changed my risk level (established one rather) and started tracking my trades in excel to understand better what is and what is not working.
Paper Trades
$EEGI In at $0.0067 and out at $0.0059 for a loss of 12%.
$CERC In at $2.53 and out at $2.57 for a gain of 1.5%.
$HMBL In at $1.63 and out at $1.68 for a gain of 3%.
$LMNL In at $5.95 and out at $6.11 for a gain of 2%.
After those paper trades, I decided that I should start looking into stocks in the $1-$10 range to increase opportunities.
Real Trades
$TRCH In at $5.075 and out the next day at $6.3232 for a gain of 24%.
$GERN In at $1.95 and out at $1.88 for a loss of -3%.
Thank you so much for taking the time to read about my stock journey. Please leave a comment below and tell me about your worst and best trades over the past month.
One Reply to “Back to a Solid Schedule: How May Wrapped Up and How June is Going”